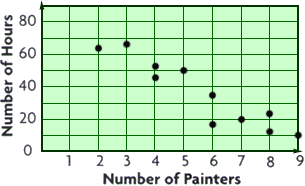
(skat´әr-plot) a plot in rectangular coordinates of paired observations of two random variables, each observation plotted as one point on the graph; the scatter or clustering of points provides an indication of the strength of the relationship between the two variables.
Found on
http://www.encyclo.co.uk/local/21001

A graph with points plotted to show a relationship between two variables
Example:

Found on
https://www.encyclo.co.uk/local/20874
No exact match found.